
Highcharts Review 2026: JS Charts & Dashboards
Review Highcharts in 2026 for JavaScript charts, dashboards, maps, and Gantt timelines, and when a browser editor is enough.
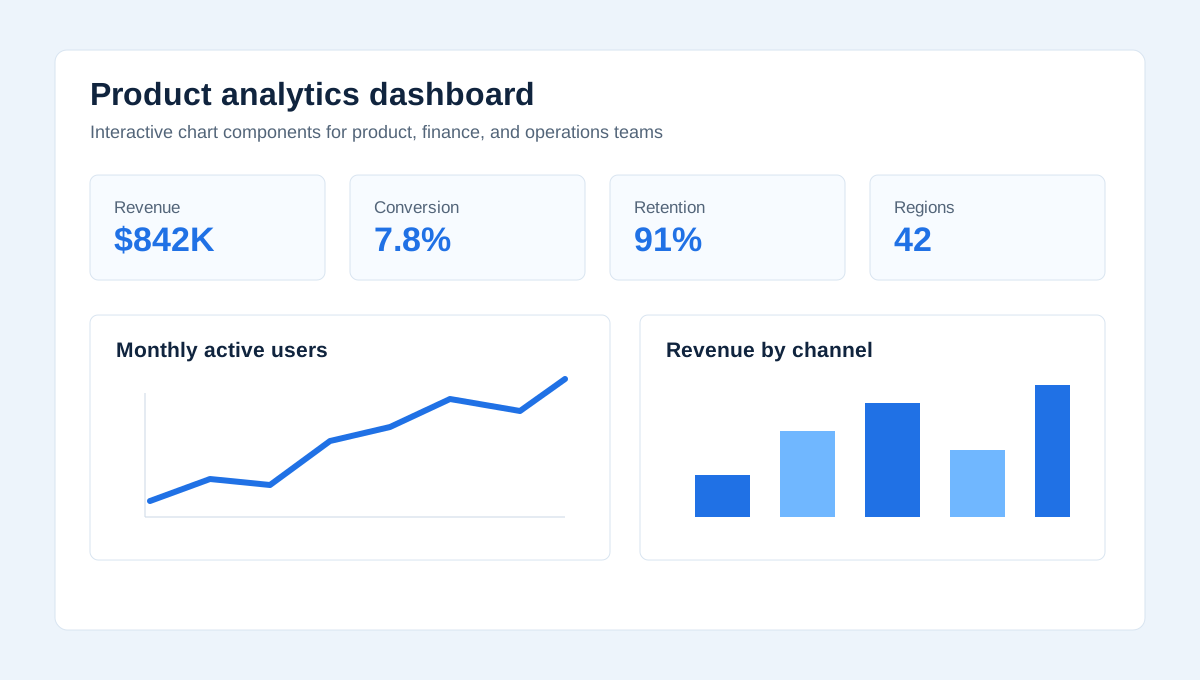
Highcharts is one of the most established JavaScript charting libraries for building interactive data visualizations in web applications. It is best known for polished SVG-based charts, broad chart type coverage, strong documentation, and a product family that extends into stock charts, maps, Gantt timelines, grids, and dashboards. It also covers many specific chart needs, including bullet charts, sunburst charts, bell curve charts, polar charts, lollipop charts, waffle charts, bubble charts, donut charts, animated pie charts, and map-based visualizations.
Bottom Line
Highcharts is a strong choice for teams that need production-grade interactive charts inside a web product. It works especially well for SaaS dashboards, financial data products, analytics portals, operations tools, internal reporting systems, and enterprise applications where charts are not decorative extras but core product surfaces.
It is not the cheapest option, and it is not the lightest charting library. The real value is maturity: chart types, documentation, accessibility work, framework wrappers, export options, map APIs, axis control, legend behavior, no data messages, and long-term stability.
Overall Scores
| Category | Score |
|---|---|
| Charting depth | 9.2 |
| Documentation | 8.8 |
| Dashboard readiness | 8.5 |
| Developer experience | 8.1 |
| Design flexibility | 8.4 |
| Licensing simplicity | 6.7 |
| Value for enterprise teams | 8.3 |
What Highcharts Does
Highcharts provides interactive JavaScript charts rendered in the browser. Developers pass data and configuration into the library, and Highcharts renders chart components such as line charts, bar charts, area charts, pie charts, scatter plots, heatmaps, maps, timelines, financial charts, bubble charts, polar charts, bullet charts, sunburst charts, lollipop charts, donut charts, and statistical charts.
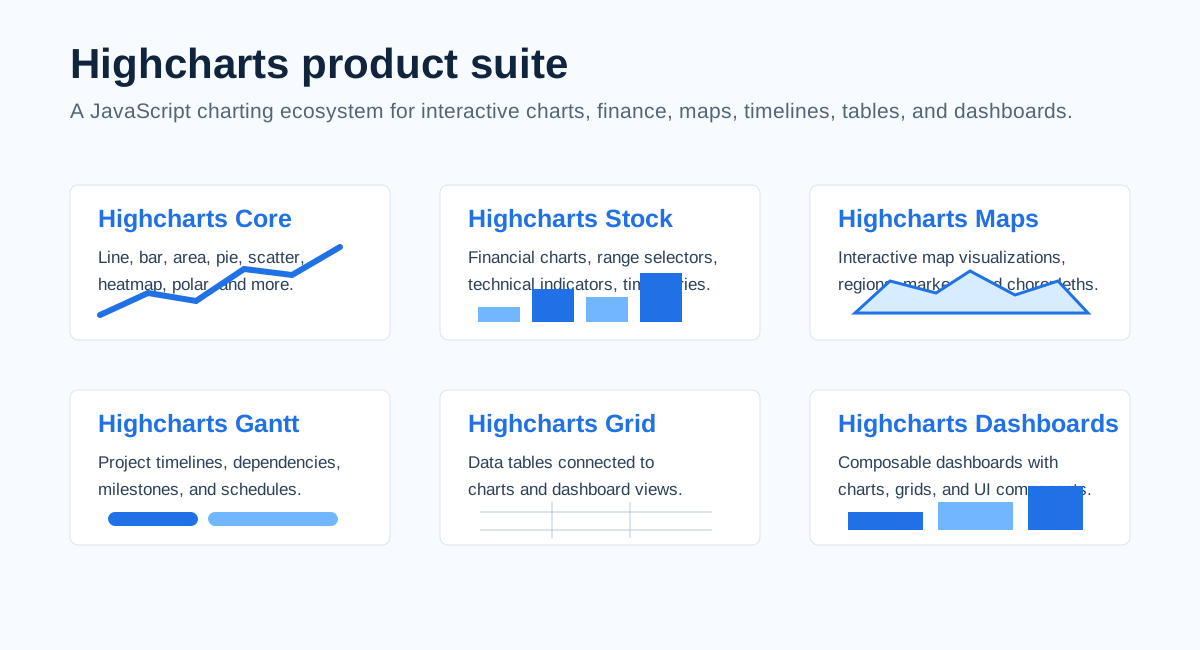
The broader product suite matters because Highcharts is not just a single charting package:
- Highcharts Core for common interactive charts.
- Highcharts Stock for financial and time-series charting.
- Highcharts Maps for geographic visualizations.
- Highcharts Gantt for project timelines and scheduling.
- Highcharts Grid for data tables.
- Highcharts Dashboards for dashboard layouts that combine charts and data components.
Primary topics covered: Highcharts review, hi chart, bullet chart, bullet graph, sunburst chart, map of biggest cities in US, plotting a bell curve, bell curve creator, bell curve generator, crypto depth chart, 3D pie chart, bar graph vs line graph, MapView API, mapview api, lollipop chart, waffle chart, waffle charts, yaxes, polar chart, bubble chart maker, what is a legend on a chart, chart for standard deviation, animated pie, no data message, pointclick, donut chart maker, positive and negative colors, ionic chart, iframe set cover image, 2.2 software license.
User Experience: Built for Developers, Not Casual Chart Making
Highcharts is a code-first charting library. It is not a drag-and-drop chart maker. The main workflow is to prepare data, define chart options, configure series, axes, labels, tooltips, events, themes, and interactions, then embed the chart inside a web app.
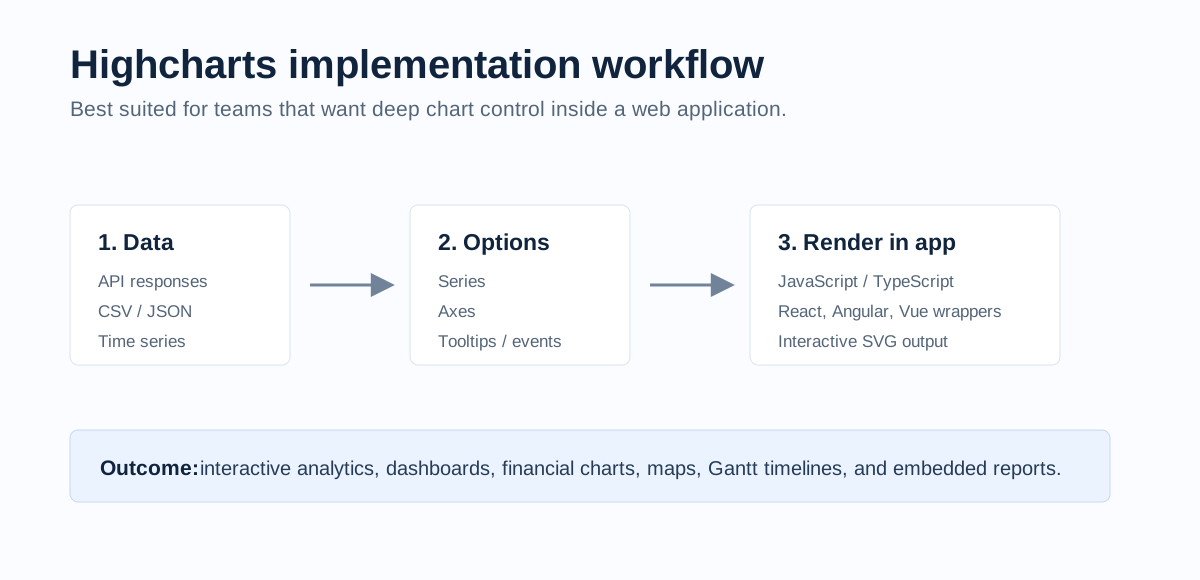
That makes Highcharts a better fit for developers than for non-technical content teams. If your team wants to manually design one chart for a blog post, Highcharts is probably more tooling than you need. If your product needs dozens of reusable interactive charts, Highcharts becomes much more compelling.
Key Strengths
1. Deep Chart Type Coverage
Highcharts covers common business charts as well as more specialized visualizations. Core charts handle everyday dashboards, while Stock, Maps, and Gantt extend the library into finance, geography, and project planning.
This breadth is valuable for product teams. You can start with basic line and column charts, then add maps, timelines, financial data views, bullet charts, sunburst charts, polar charts, bubble charts, donut charts, and lollipop charts without switching libraries.
2. Mature Documentation and Examples
Highcharts has extensive documentation, demos, API references, and integration examples. This matters because complex charting work often comes down to small configuration details: axes, yaxes, labels, legends, tooltips, annotations, responsive rules, pointclick events, positive and negative colors, no data messages, and export behavior.
For teams maintaining charts over years, documentation quality is not a nice-to-have. It directly affects development speed and long-term maintainability.
3. Strong Fit for Interactive Dashboards
Highcharts is particularly good for dashboards where users need hover tooltips, zooming, legends, drilldowns, annotations, linked charts, and polished interactions.
It is a better fit for product dashboards than static chart image tools because the chart remains interactive inside the browser. For SaaS products, analytics tools, and enterprise portals, that interactivity can be a core part of the user experience.
4. Enterprise-Ready Ecosystem
Highcharts has been around long enough to develop an ecosystem around framework integrations, accessibility, exporting, modules, and commercial support. For enterprise teams, that maturity can reduce risk compared with smaller or newer charting libraries.
5. Good Visual Defaults
Highcharts charts usually look presentable without heavy styling. The defaults are restrained and professional, which helps teams ship dashboards faster. Custom themes are still possible when brand alignment matters.
Weaknesses
1. Licensing Requires Attention
Highcharts is free for some non-commercial use, but commercial usage requires a license. This is often the biggest decision point. Before adopting Highcharts in a product, a team should confirm the correct license type and budget.
For commercial SaaS products, internal enterprise systems, and customer-facing dashboards, licensing should be considered early rather than after implementation.
2. It Can Feel Heavy for Simple Use Cases
If you only need a basic chart on a landing page, a lightweight library or embedded chart may be enough. Highcharts shines when charts are central to the application, not when you need one simple graphic.
3. Advanced Customization Still Takes Work
Highcharts gives developers a lot of control, but complex visual requirements still require careful configuration. Custom annotations, multi-axis charts, dense tooltips, responsive dashboards, and accessibility details take time to get right.
4. Not a Business Intelligence Tool
Highcharts renders charts; it does not replace a full BI platform. You still need data modeling, permissions, querying, caching, and dashboard logic around it.
Best Fit and Poor Fit
| Recommended for | Be cautious if |
|---|---|
| SaaS dashboards and analytics products. | You only need one static chart for a page or article. |
| Financial products that need time-series or stock charts. | You cannot justify a commercial license. |
| Enterprise portals with many interactive charts. | Your team needs a no-code chart builder. |
| Maps, Gantt timelines, bullet charts, sunburst charts, polar charts, and specialized visualizations. | You need a full BI platform rather than a charting library. |
| Teams that value long-term documentation and support. | You prefer a fully open-source stack for all charting needs. |
Popular Highcharts Use Cases
JavaScript Charts for Web Applications
Highcharts is a strong option when charts need to live directly inside a web application. It gives developers control over data, chart behavior, events, responsiveness, and integration with the surrounding UI.
SaaS Analytics Dashboards
For SaaS products, Highcharts can power product analytics, customer metrics, revenue charts, usage trends, retention views, and operations dashboards. It works well when charts must be reusable components rather than exported images.
Bullet Chart and Bullet Graph
Highcharts is useful for bullet chart and bullet graph use cases where a compact performance indicator needs to compare an actual value against a target or qualitative range. This is relevant for KPI dashboards, sales targets, service-level metrics, and executive reporting.
Sunburst Chart and Hierarchical Data
The sunburst chart is useful when teams need to show hierarchical categories in a radial layout. Highcharts is a good fit for product taxonomies, cost breakdowns, file structures, portfolio allocations, and other nested data structures.
Bell Curve and Standard Deviation Charts
Searches such as "plotting a bell curve," "bell curve creator," "bell curve generator," and "chart for standard deviation" point to statistical visualization needs. Highcharts can support these use cases when the data series is calculated first and then rendered as a line, area, or distribution-style chart.
Bar Graph vs Line Graph
Highcharts works well for both bar graphs and line graphs. A bar graph is better for category comparison, while a line graph is better for trends over time. The library gives developers enough control to switch between the two without changing the whole visualization stack.
Bubble, Donut, Polar, Lollipop, and Waffle Charts
Highcharts can cover many specialized chart patterns, including bubble chart maker use cases, donut chart maker use cases, polar charts, lollipop charts, waffle charts, animated pie charts, and 3D pie chart examples. Some require modules or more careful configuration, but the library has the breadth for teams that need more than basic line and bar charts.
Financial Charts and Stock Data
Highcharts Stock is designed for financial time-series use cases. It is relevant for products that need range selectors, dense time-series data, technical indicators, crypto depth chart explanations, and market-style chart behavior.
Interactive Maps
Highcharts Maps is useful when geographic data needs to be part of a dashboard or report. It can support region-based data, choropleth maps, markers, and interactive map-driven exploration. It is relevant for map search intents such as "map of biggest cities in US" and developer searches around the MapView API or mapview api.
Gantt Charts and Project Timelines
Highcharts Gantt is useful for project plans, schedules, dependencies, milestones, and resource timelines. This makes it relevant for project management tools, construction workflows, operations planning, and internal delivery dashboards.
Embedded Enterprise Reporting
Highcharts is a good fit for enterprise reporting when reports are part of a larger application. Instead of sending users to a separate BI system, teams can embed interactive charts directly into their own software.
Chart Events, Legends, and Empty States
Highcharts is also useful when teams need chart-level interaction details such as pointclick events, legends, custom legend behavior, and no data message states. These details matter in production dashboards because users need feedback when a chart has no data or when a legend controls series visibility.
Framework and App Integrations
Highcharts can be used in modern app stacks where developers need JavaScript charting inside React, Angular, Vue, Ionic, or embedded iframe contexts. Search terms such as "ionic chart" and "iframe set cover image" usually point to integration questions rather than chart type questions.
How It Compares With Alternatives
If you need a free open-source charting library, Apache ECharts, Chart.js, and Plotly may be better starting points. If you need highly custom data visualization, D3 offers maximum flexibility but requires more engineering effort.
Highcharts sits in a pragmatic middle ground: more polished and enterprise-ready than many lightweight libraries, easier than building everything with D3, but more license-sensitive than fully open-source alternatives.
If your main need is static charts for emails or PDFs, QuickChart is more appropriate. If your main need is no-code storytelling charts, Datawrapper or Flourish may be better. If your main need is embedded interactive product charts, Highcharts is one of the strongest options.
Final Recommendation
Use Highcharts when charts are a serious part of your product experience. It is a strong choice for teams that need interactive dashboards, financial charts, maps, Gantt timelines, polished defaults, and reliable documentation.
Do not choose it just because you need one simple chart. Choose it when your application needs a durable charting foundation and the licensing model fits your project.
FAQ
What is Highcharts used for?
Highcharts is used to build interactive charts and data visualizations in web applications, dashboards, reports, financial products, maps, project timeline interfaces, bullet charts, sunburst charts, bubble charts, donut charts, and statistical visualizations.
Is Highcharts free?
Highcharts can be used freely in some non-commercial contexts, but commercial usage generally requires a paid license. Teams should confirm licensing before using it in production.
Is Highcharts good for dashboards?
Yes. Highcharts is well suited for interactive dashboards, especially when charts need tooltips, zooming, drilldowns, annotations, export options, and reusable configuration.
How does Highcharts compare with Chart.js?
Chart.js is lighter and often simpler for basic charts. Highcharts is broader and more mature for complex dashboards, stock charts, maps, Gantt timelines, and enterprise requirements.
Is Highcharts better than D3?
It depends on the goal. D3 offers deeper custom visualization control, but it requires more engineering work. Highcharts provides ready-made chart types and a more product-oriented API.
Does Highcharts support maps?
Yes. Highcharts Maps supports interactive map visualizations, including region-based data and map-driven dashboards.
Does Highcharts support Gantt charts?
Yes. Highcharts Gantt supports project timelines, schedules, milestones, and dependency-style planning views.
Can Highcharts create bullet charts?
Yes. Highcharts supports bullet chart and bullet graph use cases, which are useful for showing progress against a target in compact KPI dashboards.
Can Highcharts create sunburst charts?
Yes. Highcharts supports sunburst charts for hierarchical data, such as nested categories, product taxonomies, portfolio structures, and cost breakdowns.
Can Highcharts plot a bell curve?
Yes. Highcharts can render a bell curve if the distribution data is prepared first. It can also support standard deviation charts when the statistical values are calculated before rendering.
What is a legend on a chart?
A legend explains which color, line, marker, or series corresponds to each data category. In Highcharts, legends can also be interactive, allowing users to show or hide chart series.
Can Highcharts handle no data messages?
Yes. Highcharts can display a no data message when a chart has no series or no available data, which is important for production dashboards and reports.
Does Highcharts support click events on chart points?
Yes. Highcharts supports pointclick-style interactions through chart events, allowing developers to respond when users click individual data points.
Try in BeCharts
Open ready-made line charts templates or jump straight into the editor with sample data loaded.