QuickChart Review 2026: Chart Image & QR Code API
Review QuickChart for 2026: Chart.js chart image API for email and PDFs, PNG/SVG export, plus QR code API for bulk, vCard, and spreadsheet workflows.
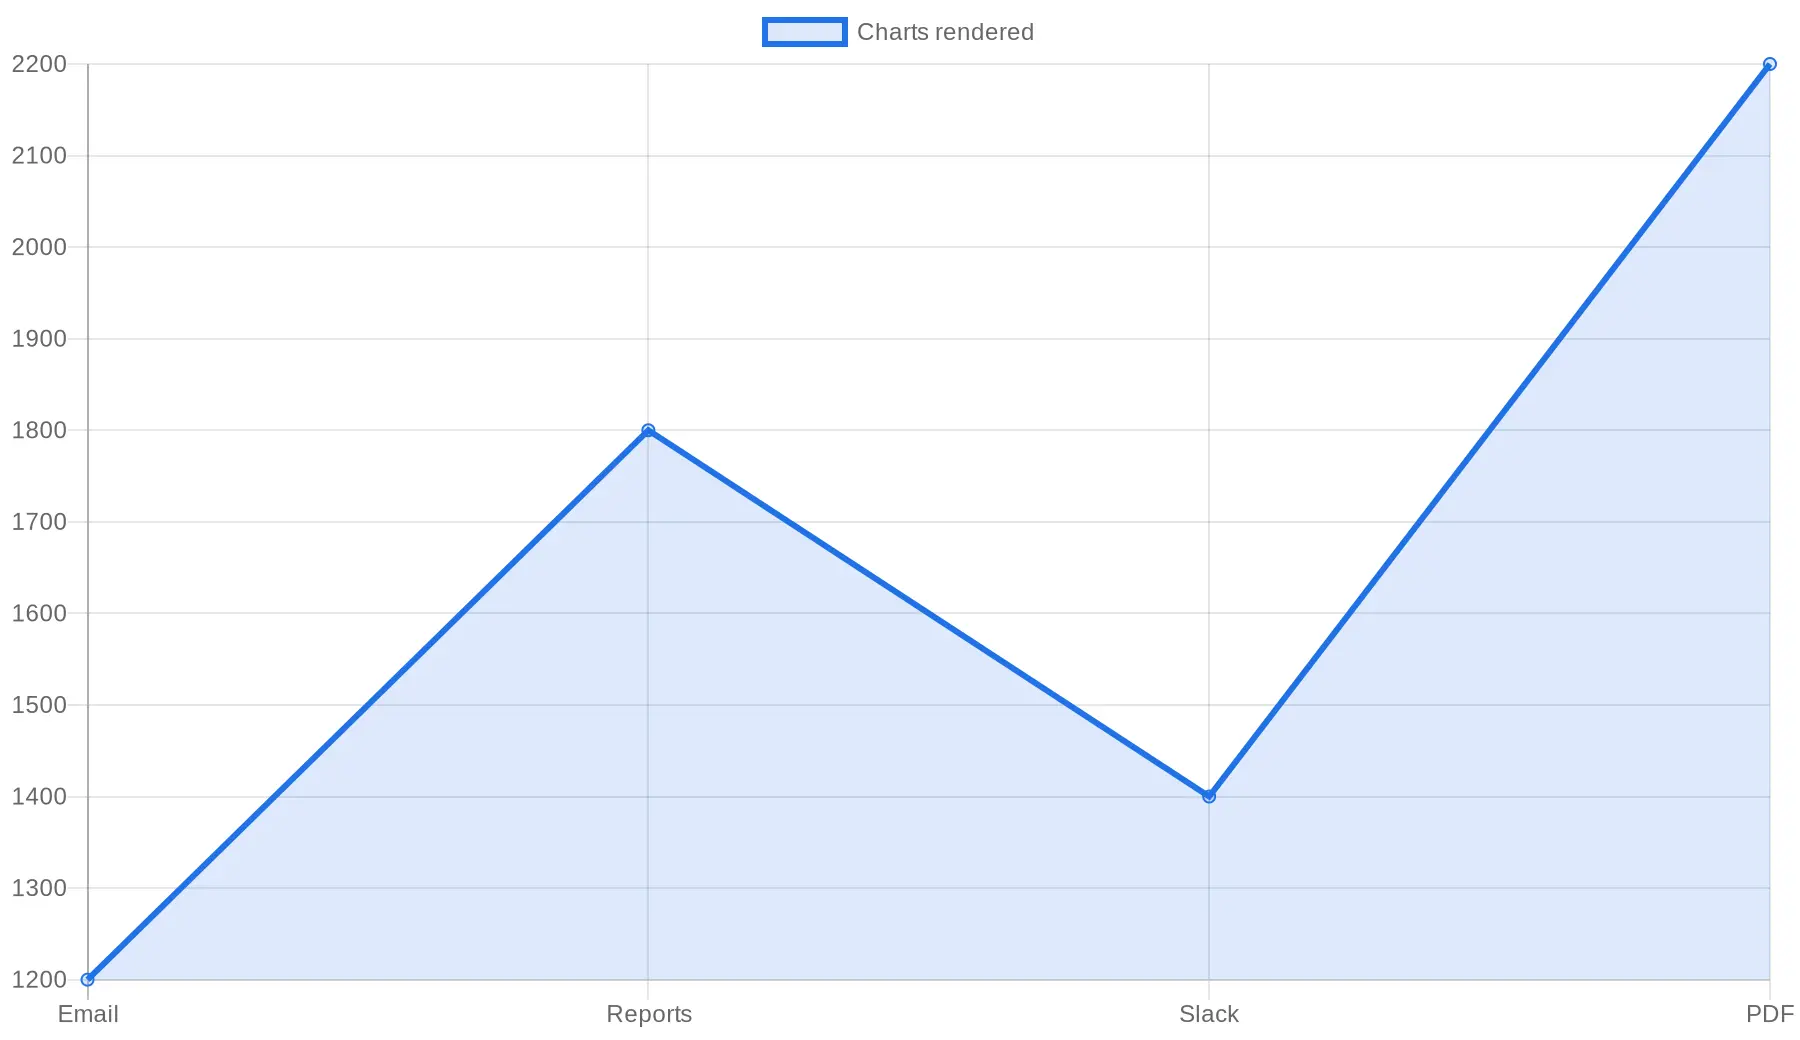
QuickChart is a developer-focused chart image API and QR code generator API. It turns Chart.js-style configuration into static images and URLs for emails, PDFs, Slack alerts, SMS, chatbots, and backend automation — environments where interactive JavaScript charts fail.
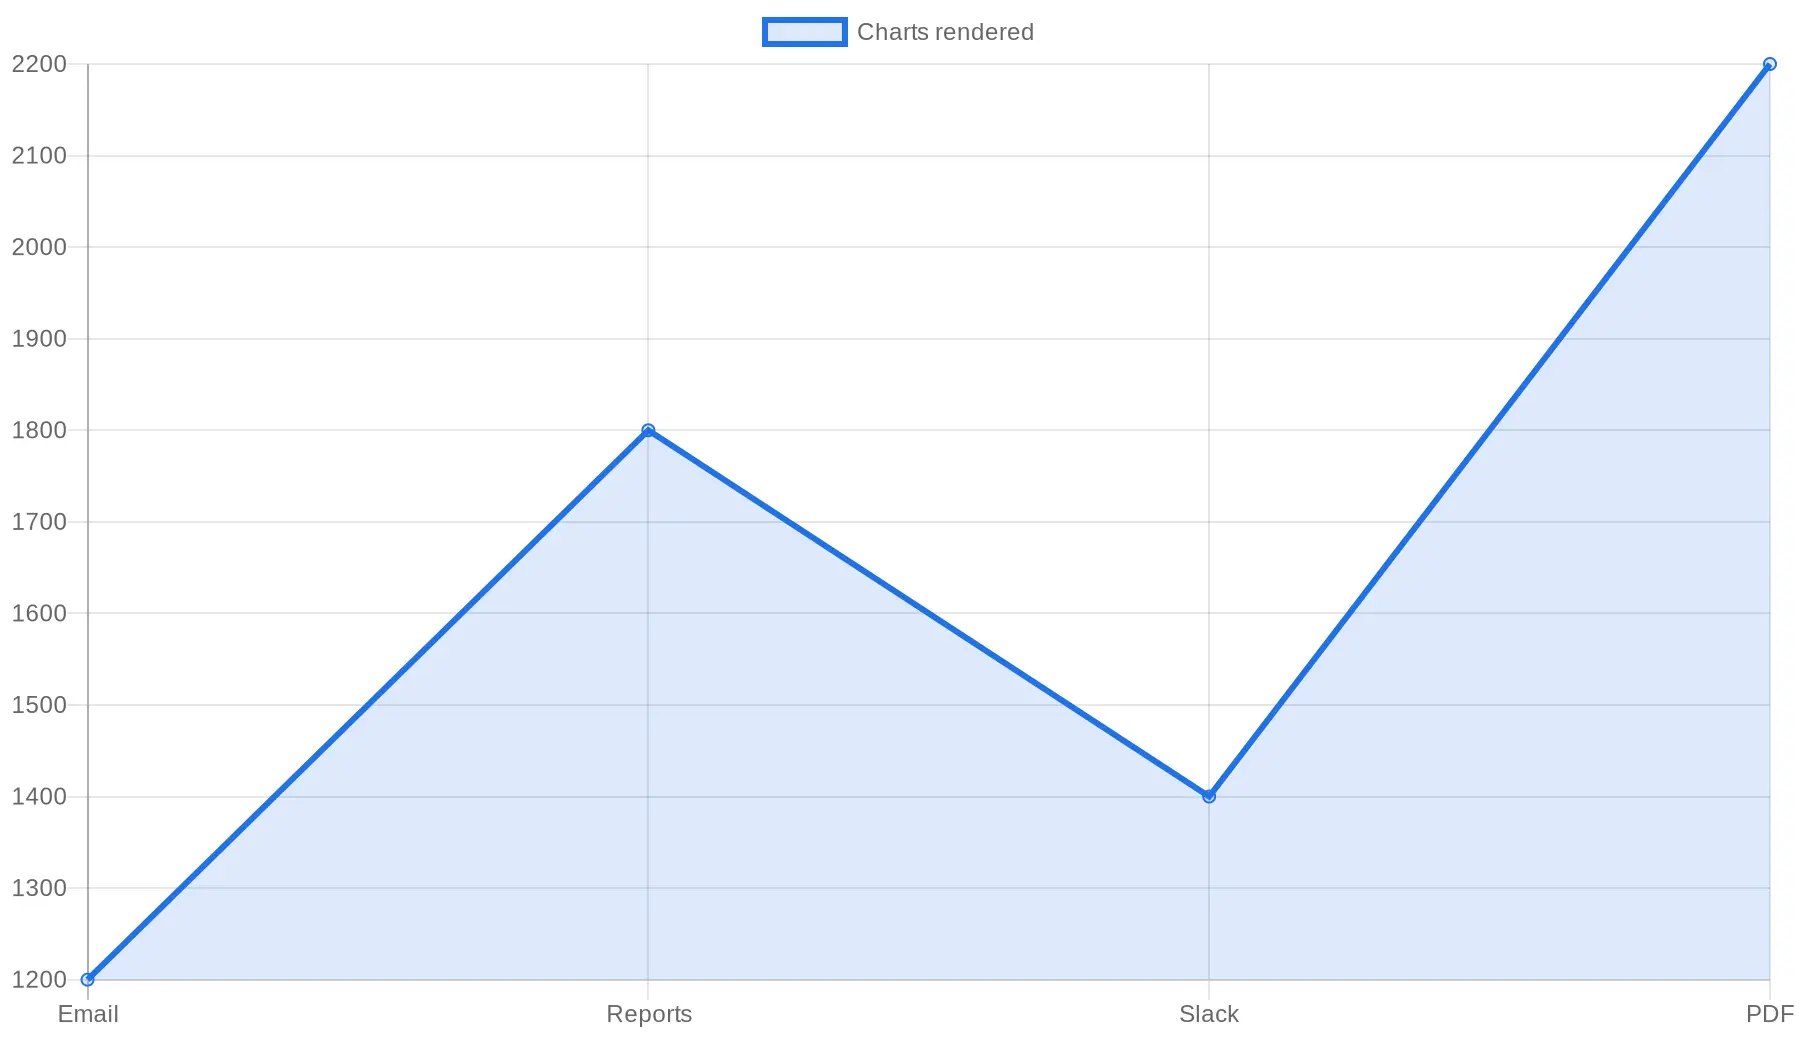
Bottom Line
QuickChart is strongest when charts must exist outside the browser: email reports, PDF pipelines, notifications, and on-demand image URLs. It also supports bulk QR generator workflows, vCard QR code output, and spreadsheet-driven QR from Excel or Google Sheets.
It is not a drag-and-drop builder for marketers or a BI dashboard. Think infrastructure: send config in, get a reliable PNG, SVG, or QR image out.
Overall Scores
| Category | Score |
|---|---|
| Developer utility | 9.0 |
| Ease of integration | 8.4 |
| Visual flexibility | 8.1 |
| Non-browser rendering | 9.3 |
| No-code friendliness | 5.8 |
| Value for money | 8.0 |
What QuickChart Does
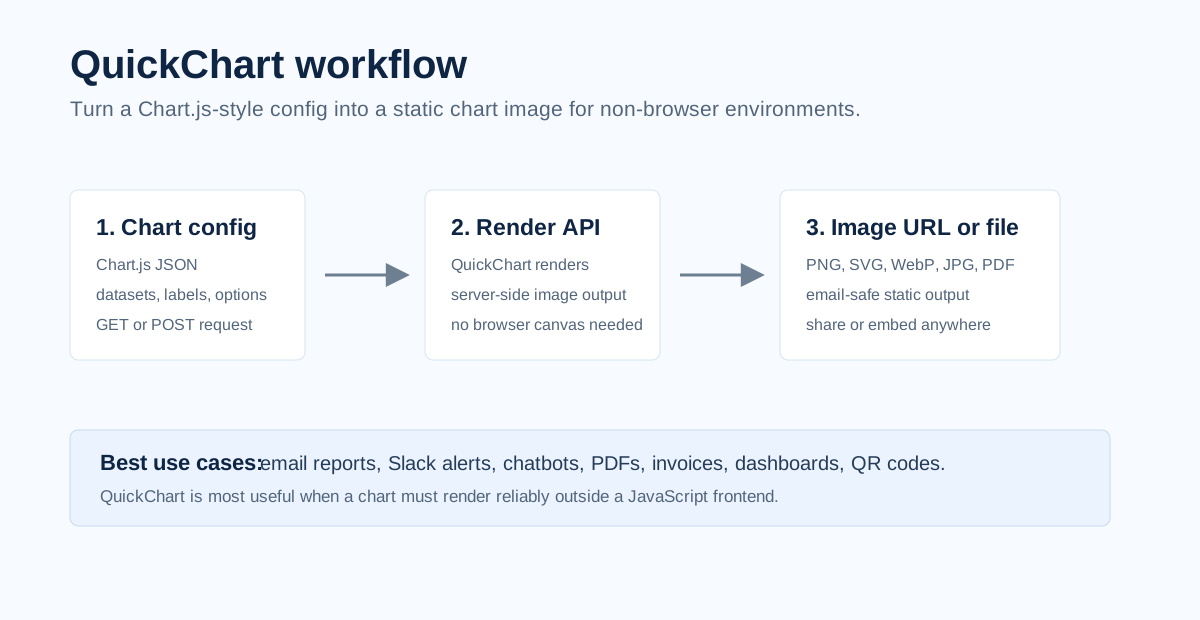
Define a chart with Chart.js-style JSON, call QuickChart via URL (GET) or POST, receive a static image. Useful when JavaScript rendering is blocked or impractical:
- Email clients, PDF generators, Slack/Teams bots
- Scheduled reports and backend systems that need image URLs
Key Features
Chart Image API (Chart.js configs)
Labels, datasets, chart types, plugins, and dimensions map to Chart.js concepts — more flexible than screenshotting a page. Supports detailed options (y-axes, fonts, horizontal stacked bar graph, 100 stacked bar graph) when configs are tuned carefully.
Output formats and integration
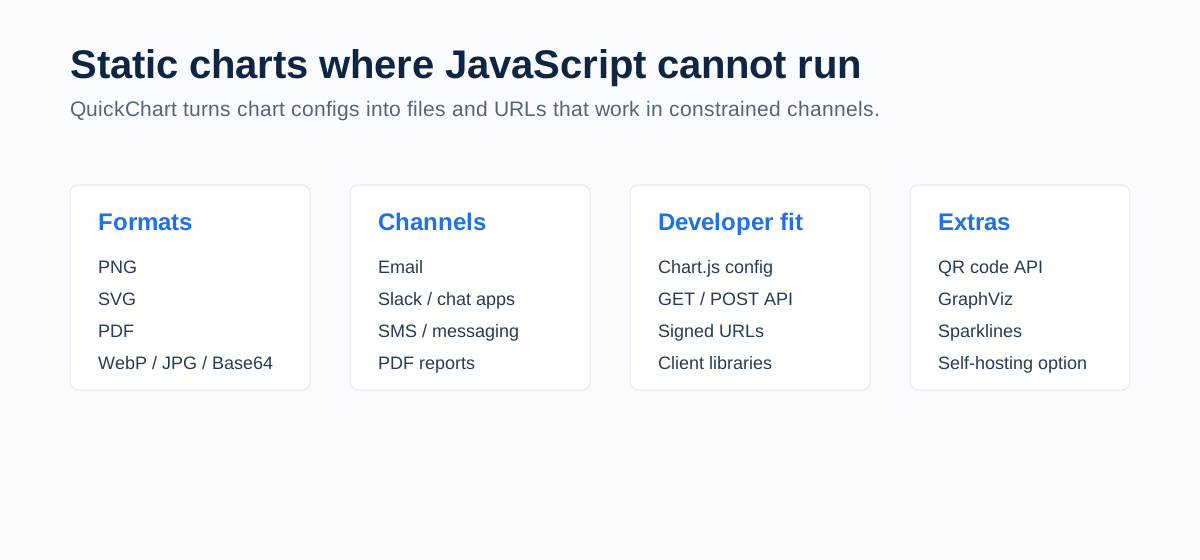
PNG and SVG for most channels; PDF, WebP, JPG, and Base64 on some endpoints. PNG is safest for email; SVG for crisp web layouts.
GET, POST, and automation
Simple charts via URL; production systems should use POST to avoid length limits. Fits weekly email metrics, incident Slack charts, and PDF embeds without a headless browser.
QR Code API
QR images from text or URLs — invoices, events, packaging, internal tools. Pairs with automation for mass QR code generator tasks, serial number QR code labels, file to QR code links, and vCard QR code / VCF contact sharing.

Spreadsheet columns can hold source URLs or vCard text; a script calls QuickChart per row (Excel QR code generator, Google Sheets QR code generator patterns).
Common integration patterns
- Email digests: cron job builds Chart.js config from metrics DB → QuickChart URL →
<img>in HTML email. - PDF reports: server fetches PNG or PDF chart bytes and embeds in document templates.
- Alerting: Slack webhook posts a trend line chart image when a threshold fires.
- Product UI: SaaS shows a shareable chart snapshot without shipping a full charting frontend to mobile clients.
These patterns share one constraint: the channel cannot run your chart JavaScript, so a chart image API is the practical bridge.
Strengths
- Server-side rendering — no browser canvas or screenshot pipeline
- Familiar Chart.js mental model for dev teams
- Email-safe PNG chart and line chart images / pie chart images
- Same API surface for charts and QR codes; optional self-hosting
Weaknesses
- Not no-code — expects JSON config and API integration
- Static output only (no hover, drilldown, or filters)
- Publication-grade design still needs careful config tuning
- Large GET URLs get messy; prefer POST in production
Best Fit and Poor Fit
| Recommended for | Be cautious if |
|---|---|
| SaaS email/PDF reports, backend chart images | Interactive dashboards with drilldowns |
| Slack, chatbot, SMS chart URLs | Drag-and-drop design for non-devs |
| Bulk QR, vCard QR, spreadsheet QR automation | One-off charts easier in a spreadsheet |
How It Compares
For interactive BI, use Looker Studio, Metabase, Tableau, or a frontend chart library. For editorial storytelling, Datawrapper, Flourish, or Canva.
QuickChart wins when output must be a chart image API file or URL generated by code. It is usually simpler than headless-browser screenshots and faster than building your own renderer.
Final Recommendation
Choose QuickChart when software must produce images for charts and QR codes automatically. Skip it for general design or live dashboards — use it when delivery channels constrain you to static assets.
If your team already maintains Chart.js configs for a web app, adding QuickChart for email and PDF variants is often a small incremental step rather than a separate charting stack.
FAQ
What is QuickChart used for?
A chart image API for emails, PDFs, reports, chatbots, and automation — plus QR code generation.
Is QuickChart based on Chart.js?
Yes — Chart.js-style configuration for both frontend familiarity and server-side image export.
Can QuickChart generate charts for email or export SVG/PDF?
Yes — static images for email (core use case); SVG, PDF, and other formats depend on endpoint and config.
Can QuickChart create PNG charts and stacked bar graphs?
Yes — PNG chart output from config, including horizontal stacked and 100% stacked bars with careful setup.
Does QuickChart support QR codes and bulk generation?
Yes — QR API for single codes; pair with backend or spreadsheet loops for bulk QR code and mass QR code generator workflows.
Can QuickChart create vCard QR codes?
Yes — encode vCard/VCF text for business cards, badges, and CRM flows.
Can QuickChart work with Excel or Google Sheets?
Store URLs or vCard text in sheets; automation calls the API per row to generate images.
Is QuickChart good for dashboards?
Good for static dashboard images and scheduled report snapshots — not a replacement for interactive BI tools.
How does QuickChart compare to screenshot-based chart rendering?
Screenshot pipelines need headless browsers, timing, and ops overhead. QuickChart renders from config directly — usually fewer moving parts for email, PDF, and notification use cases.
Can non-developers use QuickChart?
Only lightly. Marketing teams can reuse pre-built config templates, but someone technical typically owns the JSON, API keys, and automation. For manual chart design, use a visual tool; use QuickChart when generation must be programmatic.
Try in BeCharts
Open ready-made line charts templates or jump straight into the editor with sample data loaded.