

ChartGo Review 2026: Free Online Chart Maker
Review ChartGo in 2026 as an online chart maker for bar, line, and pie charts, including export limits.
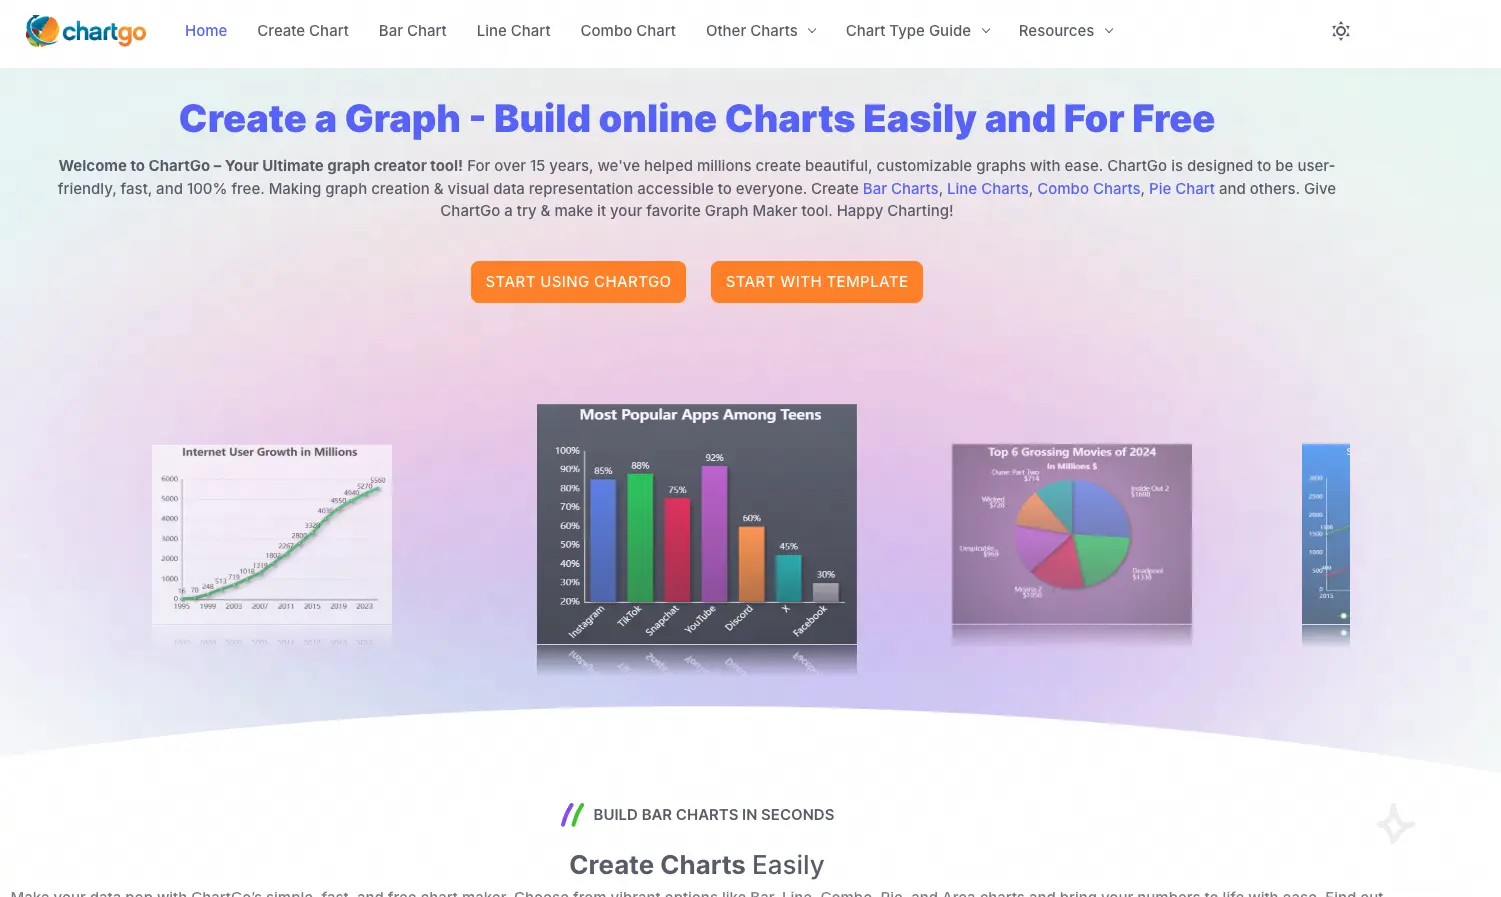
ChartGo is a completely free online chart maker and graph generator that has been running since 2009. No sign-up, no download, no payment — just open the browser, pick a chart type, enter some data, and get a shareable chart. You can create charts online in seconds: it works as a bar chart maker, line graph maker, and pie chart maker, and supports area charts, combo charts, barbell charts, and XY line charts, covering most everyday data visualization needs.
Bottom Line
ChartGo is best when you need a chart quickly and don't want to deal with accounts, subscriptions, or software installs. It is not a design tool, not a BI platform, and not a collaboration hub. It is a straightforward online chart creator that does one thing well: turn numbers into a clean, downloadable chart in under a minute.
For students, teachers, small business owners, and anyone who values speed and simplicity over pixel-perfect design, ChartGo is still a solid pick in 2026. For professionals who need interactive dashboards, team collaboration, or magazine-quality visuals, look elsewhere.
Overall Scores
| Category | Score |
|---|---|
| Ease of use | 9.2 |
| Chart type variety | 7.5 |
| Visual customization | 6.8 |
| Export and sharing | 7.0 |
| Design and aesthetics | 5.5 |
| Value for money (free) | 9.5 |
| Mobile experience | 6.0 |
What ChartGo Does
ChartGo lets anyone make charts online directly in a browser. The workflow is deliberately simple — it is one of the most straightforward options if you want to build charts online without friction:
- Choose a chart type from the navigation bar.
- Type or paste your data into the X and Y axis fields.
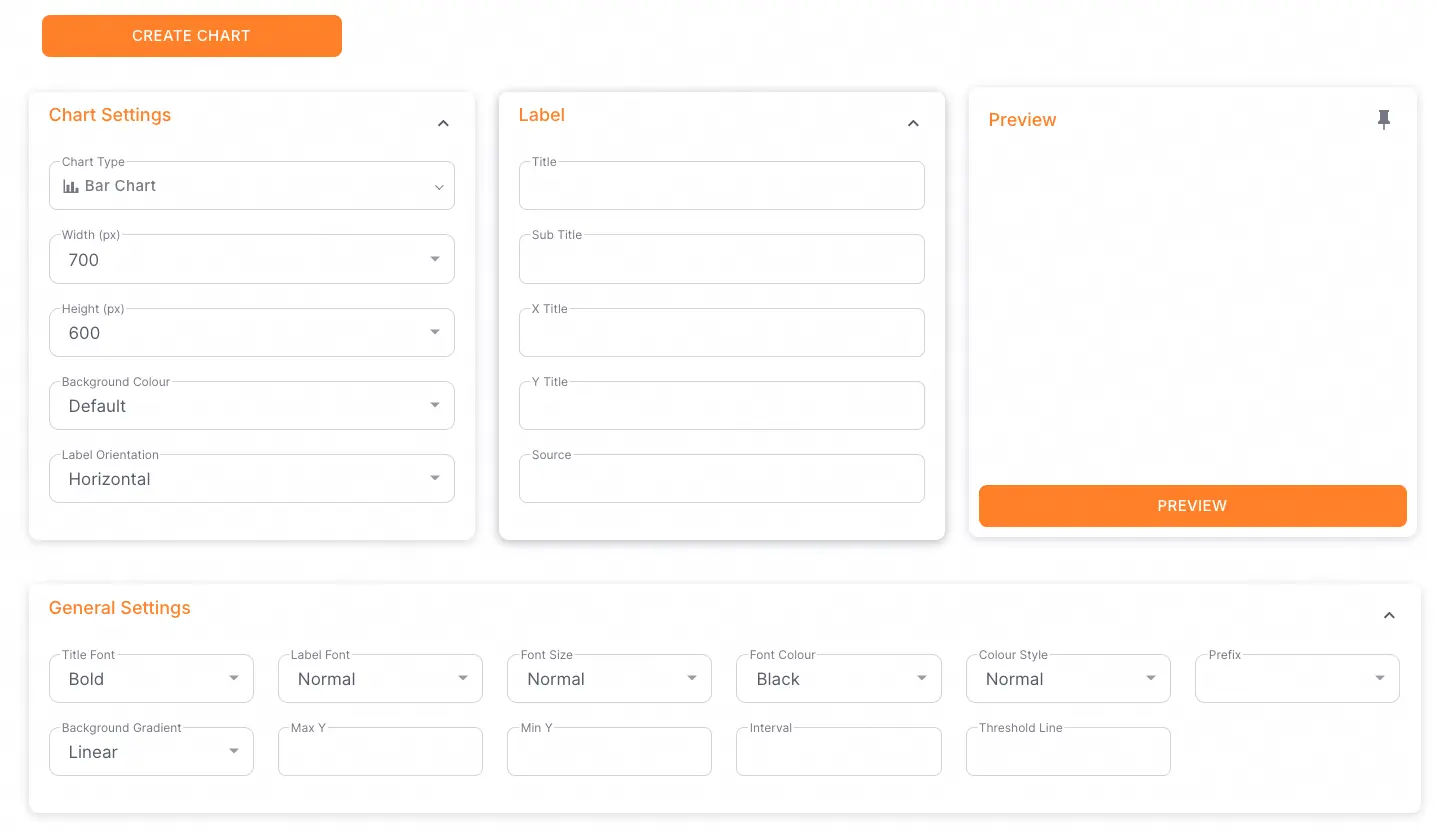
- Customize colors, background, labels, and chart dimensions.
- Click create and get a chart with save, share, embed, and download options.
That is the whole product. No onboarding flow, no tutorial popups, no dashboard — just a form and a result.
Here is what makes the tool useful across different situations:
- No registration at all. You land on the page and start creating charts online immediately. No email wall, no free trial countdown, no feature gating.
- Excel and CSV file upload. Beyond manual data entry, you can upload
.xlsxor.csvfiles, which is a practical time-saver for anyone working with spreadsheet data. - Multiple share and save links. Every chart gets four distinct links: a private edit link, a public view link, an embed link for blogs, and a clone link that gives others their own copy.
- Image and SVG export. Download charts as PNG, JPG, or SVG for use in presentations, documents, and websites.
- Chart type switching. After creating a chart, you can switch its type without re-entering data — useful for comparing how the same data looks as a bar chart versus a pie chart.
Primary topics covered: ChartGo review, free online graph maker, free chart maker, online chart maker, bar chart maker, line graph maker, pie chart maker, graph maker online, free chart maker online, create charts online, make charts online, build charts online, online chart creator, graph generator, free chart tool, data visualization for students, Excel to chart converter.
Key Features
1. Seven Chart Types in One Place
ChartGo covers the fundamentals without drifting into obscure chart types that most people never use. Whether you need a bar chart maker, a line graph maker, or a pie chart maker, it handles all three core formats:
- Bar Chart — including stacked bar charts for part-to-whole comparisons
- Line Chart — with support for multiple data series
- Pie Chart — for proportional data
- Area Chart — for volume and trend visualization
- Combo Chart — bar and line on the same axes
- Barbell Chart — highlights ranges and differences between two values
- XY Line Chart — for scatter-like connected point data
Seven types cover about 90% of what most people need for school projects, business reports, and blog posts. If you need radar charts, treemaps, or Sankey diagrams, ChartGo is not the right tool — and it does not pretend to be.
2. Customization Without Overwhelm
The customization panel gives you control over the basics without drowning you in options:
- Chart title and axis labels
- Background color and gradient backgrounds
- Label orientation
- Chart width and height
- Color themes for data series
It is not Figma. You cannot tweak every pixel, adjust kerning, or layer annotations. But for a free chart maker that takes 30 seconds to produce output, the customization range is practical. You get a chart that looks clean and branded enough for internal reports and casual presentations.
3. Smart Link System for Sharing
Most free chart tools give you one download and that is it. ChartGo gives you four links per chart, each with a distinct permission model:
| Link Type | What It Does |
|---|---|
| Save Link | Returns you to the editor to continue modifying |
| Share Link | Public view-only page, no editing access |
| Embed Link | Embeds the chart image in a blog or webpage |
| Clone Link | Creates a copy of the chart for someone else to edit |
This permission model is smarter than it looks. The save link means you do not lose your work if you close the tab. The clone link means you can share a template without giving away edit access to your original. These are small touches that show the product has been refined over 15 years.
4. Built-in Chart Templates
ChartGo includes a library of pre-made chart templates covering common scenarios — monthly sales, grade distributions, survey results, and progress tracking. Templates reduce the learning curve and help beginners understand what data format produces which chart type.
Strengths
Zero Cost, Zero Friction
ChartGo is entirely free with no "try before you pay" gotcha. ChartGo monetizes through display ads, which are visible but placed on the page periphery rather than interrupting the creation flow. In a market where every tool seems to have a pricing page, this is refreshing. As a graph maker online that costs nothing and asks nothing, it stands out.
Fastest Path From Data to Chart
The time from opening the page to having a download-ready chart is often under 60 seconds. No account setup, no workspace creation, no project naming — just data in, chart out. This speed makes ChartGo a useful companion tool even for people who primarily use heavier platforms. When you need to make charts online fast, few tools match this turnaround.
Good for Privacy-Conscious Users
Since there is no account system, you are not handing over an email address, name, or organization. Chart data is processed on the server but not tied to a persistent identity. For quick one-off charts with sensitive numbers, this is a practical advantage.
Educational Value
ChartGo includes a built-in guide section covering chart type selection, data formatting best practices, and tutorials. Combined with the template library, it serves as a gentle introduction to data visualization for students and beginners looking for a free chart maker online to learn with.
File Upload Saves Time
The Excel and CSV upload feature means you can take data you already have in a spreadsheet and turn it into a chart without retyping. This is especially useful for teachers working with grade data or small business owners tracking monthly sales.
Weaknesses
Dated Visual Design
The UI looks like it was built around 2015 and has not had a major redesign since. The Bootstrap-based layout, default styling choices, and overall visual density feel behind modern web tools. The charts themselves look functional rather than beautiful — think Excel default charts, not Canva infographics.
No Interactive Charts
Every chart is a static image or SVG. There is no hover-to-see-values, no click-to-filter, no animation, no zoom. For embedding on modern websites where readers expect interactivity, this is a limitation. Tools like Flourish and Datawrapper have raised expectations here.
Limited Export Formats
Export options are PNG, JPG, and SVG. There is no PDF export, no direct HTML embed code from the editor, and no integration with Google Slides or PowerPoint. If your workflow ends in a presentation tool, you will need an extra conversion step.
No Account Means No History
Without user accounts, there is no chart history, no dashboard of past creations, and no cross-device sync. The save link is the only way to return to a chart later. Lose that link, and the chart is gone. For occasional use this is fine; for regular use it becomes a friction point.
Ads Are Present
The ad-supported model means banner ads appear on the page. While they are not aggressive or intrusive, they do detract from the professional feel of the tool. If you are presenting your screen during a meeting, the ad banners are visible.
No Team or Collaboration Features
There is no way to share edit access with a colleague, leave comments on a chart, or work on the same visualization together. ChartGo is a solo tool designed for individual use.
Comparison at a Glance
| Tool | Price | Sign-up | Best For |
|---|---|---|---|
| ChartGo | Free | No | Quick solo charts, students, teachers |
| Canva | Freemium | Yes | Designed visuals, social media graphics |
| Google Sheets | Free | Yes | Data-native charts, collaboration |
| QuickChart | Freemium | Yes | Developer API, automated chart images |
| Flourish | Freemium | Yes | Interactive, animated data stories |
Who Should Use ChartGo
Great fit for:
- Students who need a bar or pie chart for an assignment in 5 minutes
- Teachers creating quick visual aids for lesson materials
- Small business owners tracking simple metrics without learning Excel charts
- Bloggers who need a chart image to embed in a post
- Anyone who values privacy and wants to create charts without creating an account
Not a great fit for:
- Data analysts building interactive dashboards
- Designers who need pixel-perfect, brand-aligned chart styling
- Teams that need shared workspaces and real-time collaboration
- Marketers creating social media infographics with heavy visual polish
- Developers who need a chart API for automated image generation (use QuickChart instead)
Final Word
ChartGo is an honest tool. It does not overpromise, does not lock features behind a paywall, and does not force you into an account just to try it. In 15 years of operation, it has stayed true to a simple idea: making charts should be free and fast.
The design is dated. The charts are not beautiful. The feature set stops where modern data tools begin. But for the person who just needs a bar chart right now — no login, no learning curve, no cost — ChartGo still works exactly as advertised. That kind of reliability, especially in a fully free online chart maker, is rare and worth recognizing.
If your priority is speed, simplicity, and zero friction, ChartGo earns its place in your bookmarks.
FAQ
What is ChartGo?
ChartGo is a free online graph maker that lets you create charts directly in a browser without signing up. It has been running since 2009 and supports bar charts, line charts, pie charts, area charts, combo charts, barbell charts, and XY line charts.
Is ChartGo really free?
Yes. ChartGo is a completely free chart maker with no paid plans, no feature gating, and no trial periods. It is supported by display ads on the page, but there is no "free trial" that expires or "premium" tier hidden behind a paywall.
Can I create charts online without signing up?
Yes. One of ChartGo's biggest advantages is that you can create charts online with zero registration. You land on the page, enter data, customize, and download — no email, no password, no account required.
What chart types does this chart maker support?
ChartGo works as a bar chart maker (including stacked bars), line graph maker, pie chart maker, area chart tool, combo chart tool, barbell chart tool, and XY line chart tool. These seven types cover most everyday needs for school, business, and personal projects.
Can I use ChartGo to make charts online from spreadsheet data?
Yes. ChartGo supports Excel (.xlsx) and CSV file uploads, so you can take data from a spreadsheet and turn it into a chart without retyping everything manually.
How do I share or download charts from ChartGo?
Every chart comes with four link types: a save link for returning to edit, a share link for public viewing, an embed link for blogs, and a clone link for others to make their own copy. You can also download charts as PNG, JPG, or SVG files.
Is ChartGo a good graph generator for students?
Yes. ChartGo is well suited for students who need to create charts for assignments, projects, and presentations. It requires no sign-up, costs nothing, and includes built-in templates and a guide section that helps beginners understand chart types and data formatting.
How does ChartGo compare to other online chart creators?
Compared to tools like Canva, Flourish, or Google Sheets, ChartGo is simpler, faster, and fully free. It lacks the design polish and interactivity of those tools, but it wins on speed and zero friction. If you need to build charts online in under a minute with no account, ChartGo is one of the fastest options available.
Can I use ChartGo on mobile?
ChartGo works in a mobile browser, but the interface is not optimized for small screens. It is best used on a desktop or laptop. The mobile experience is functional but clunky compared to dedicated mobile charting apps.
Does ChartGo support interactive or animated charts?
No. All charts produced by ChartGo are static images or SVGs. There is no hover interaction, no click filtering, no animation, and no zoom. If you need interactive charts, consider tools like Flourish, Datawrapper, or a JavaScript charting library.
Try in BeCharts
Open ready-made bar charts templates or jump straight into the editor with sample data loaded.