

Visme graph maker review for 2026
Review Visme as a column chart and dot plot maker, and compare it with spreadsheet charts and lighter editors.
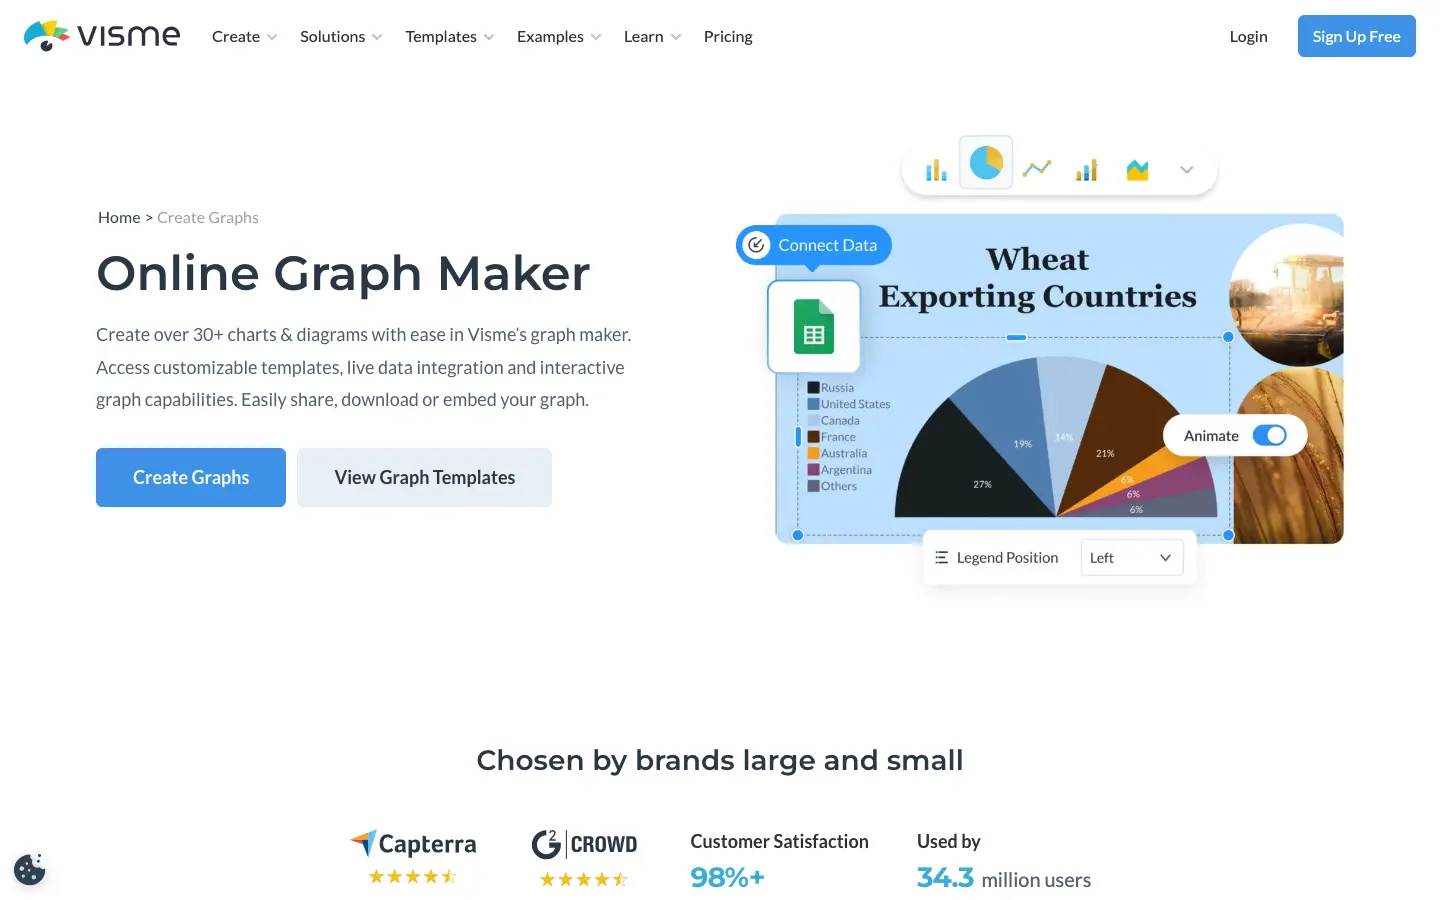
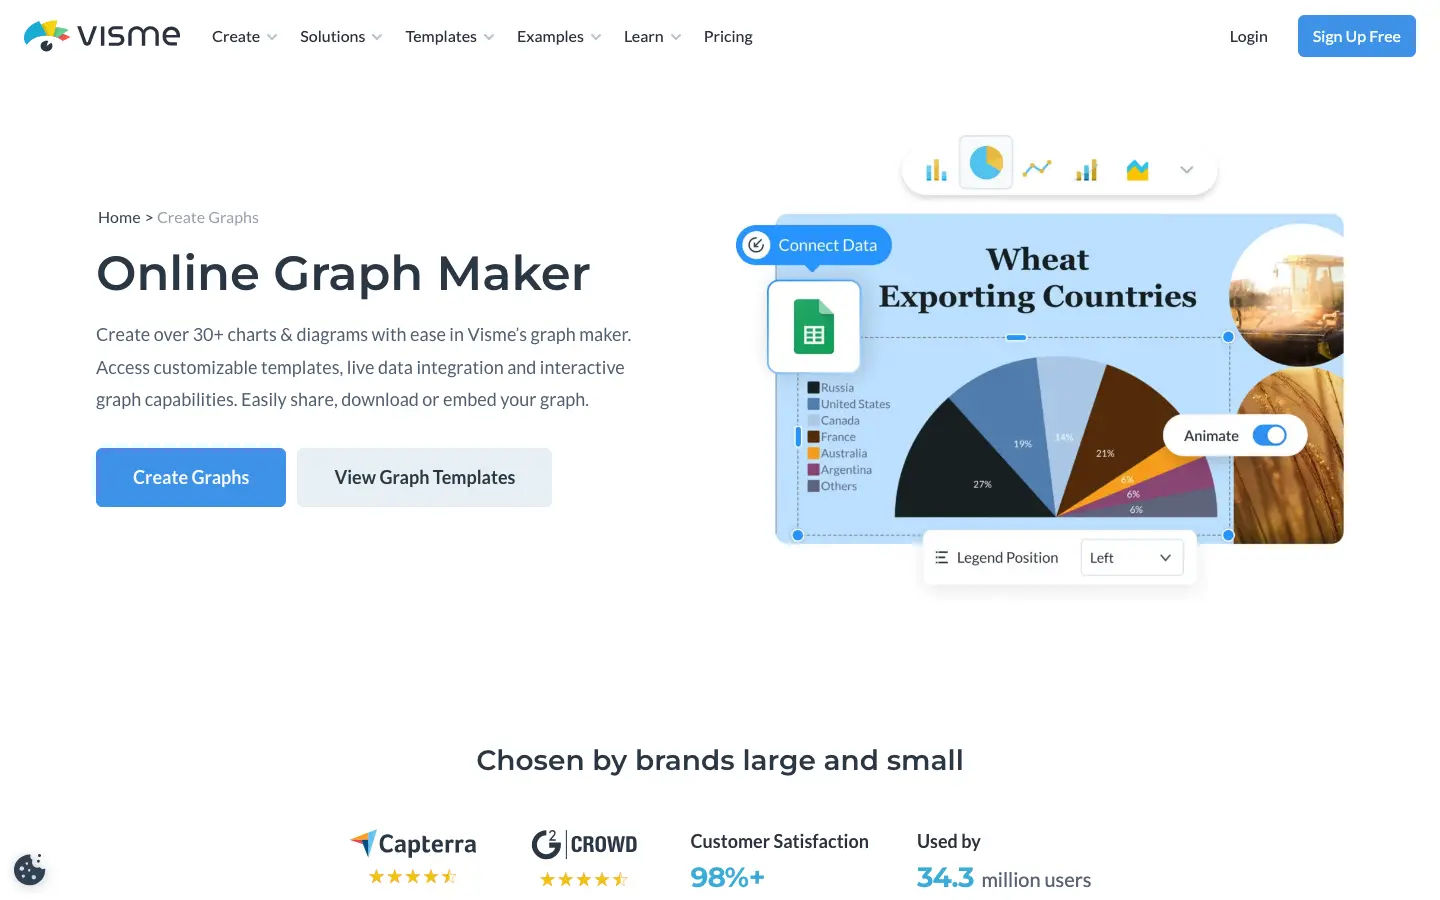
Visme is a visual communication platform with a built-in online graph maker supporting 30+ chart types — column and bar charts, dot plots, mosaic plots, and economics-style curves. It targets professionals who need presentation-ready charts inside reports, infographics, and social content, not a no-sign-up tool for one-off homework charts.
Bottom Line
Visme fits teams and creators who need branded, animated charts inside larger design projects. Sign-up is required; the free plan is limited. You get live Google Sheets links, brand kits, HTML5 export, and far more chart types than lightweight tools like ChartGo or Graphfree.
For a single bar chart in 30 seconds with no account, use a free chart maker instead. For column charts, dot plots, or economics graph maker diagrams that must look client-ready, Visme is one of the stronger options in 2026.
Overall Scores
| Category | Score |
|---|---|
| Ease of use | 8.0 |
| Chart type variety | 9.2 |
| Visual customization | 9.0 |
| Export and sharing | 9.0 |
| Design and aesthetics | 9.2 |
| Value for money | 7.5 |
| Collaboration and teamwork | 8.5 |
What Visme Graph Maker Does
Charts can stand alone or sit inside presentations, reports, and infographics in one editor:
- Sign up and pick a graph template (or start blank).
- Import data manually, via Excel/CSV, or a live Google Sheet.
- Customize layout, colors, brand assets, and animations.
- Export PNG, JPG, PDF, PPT, or HTML5 — or share via link or embed.
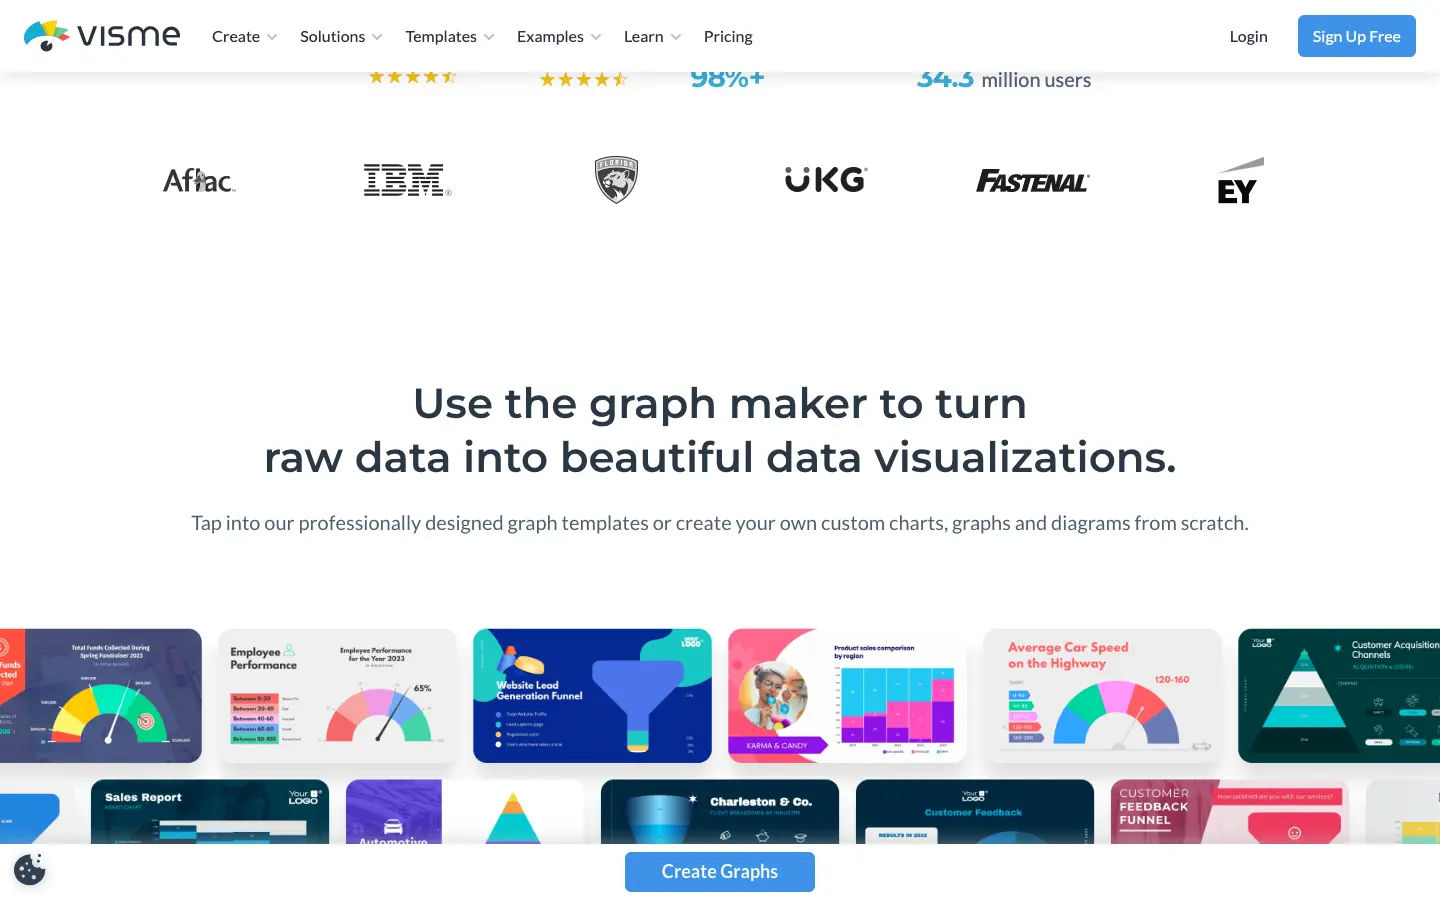
Standout capabilities: live data from Sheets, brand kit one-click styling, 30+ chart types, design canvas around the chart, and interactive HTML5 embeds.
Key Features
Chart types and niche workflows
Visme works as a column chart maker, bar chart maker, line graph maker, and pie chart maker, plus scatter/dot plots, histograms (frequency graph maker), funnel, radar, treemap, and mosaic plot maker layouts.
| Search intent | How Visme handles it |
|---|---|
| Column chart maker | Stacked/grouped columns, brand colors, PDF/PPT export |
| Dot plot creator | Scatter-style charts with labeled, colored series |
| Economics graph maker / econ graph generator | Supply/demand and cost curves with axis control |
| Graph maker based off conditions | Filter data in the editor or Sheets, then bind series |
Google Sheets vs Visme
How to make a bar graph in Google Sheets: select data → Insert → Chart → bar/column type. Use Sheets when the chart stays in the spreadsheet. Use Visme when you need branded column chart maker output, animation, or a live embed that updates from the same Sheet without rebuilding slides weekly.
Design, export, and templates
Brand kits, full color control, icons and text on the canvas, and chart animations. Exports include PNG, PDF, PPT, and interactive HTML5. Hundreds of templates cover reports, education, and marketing; premium layouts need a paid plan.
Strengths
- Polished, professional chart output without a dedicated designer
- 30+ chart types — broader than most free online graph makers
- Live Google Sheets sync for recurring reports
- Charts live inside full visual projects (not a siloed chart-only app)
- Brand kit and HTML5 interactivity rare among simple chart tools
Weaknesses
- Free tier limits templates, brand kit, and exports
- Sign-up required; slower than Graphfree/ChartGo for one-off charts
- Learning curve for animation and multi-page projects
- Browser-only; team pricing adds up if you only need charts
Comparison at a Glance
| Tool | Price | Sign-up | Best For |
|---|---|---|---|
| Visme | Freemium (~$12.25/mo+) | Yes | Branded charts, dot plots, economics diagrams |
| Graphfree / ChartGo | Free | No | Fast static charts, no design layer |
| Google Sheets | Free | Yes | In-sheet bar graphs, raw data collaboration |
| Canva | Freemium | Yes | General design, lighter chart depth |
| Flourish | Freemium | Yes | Interactive data stories |
Who Should Use Visme Graph Maker
Great fit for: marketing and agency teams, consultants, educators (economics graph maker workflows), and anyone needing live Sheet-linked charts with brand consistency.
Not a great fit for: instant no-login charts, R/Python statistical pipelines, or teams that only need charting without the wider design suite.
Final Word
Visme trades friction for output quality. Complexity and cost are real, but for branded reports, client decks, and interactive embeds, its graph maker remains one of the most capable online graph makers in 2026.
FAQ
What is Visme's graph maker?
An online graph maker inside Visme with 30+ types, Google Sheets live data, brand kits, and multi-format export.
Is Visme free?
A free plan exists; brand kit, premium templates, and full exports usually need Starter ($12.25/mo annual) or Pro ($24.75/mo annual).
Is Visme a good column chart maker or dot plot creator?
Yes — stacked/grouped columns, branded templates, and scatter/dot plots for reports and slides. Stronger than basic free tools when you need PDF, PPT, or live Sheet data.
Does Visme work as an economics graph maker?
Yes — supply/demand and cost curves with template starts and manual axes; a practical econ graph generator for courses and client memos.
Can Visme make frequency graphs or mosaic plots?
Histograms cover frequency graph maker needs; treemap/mosaic layouts handle multi-category proportions.
How do I make a bar graph in Google Sheets vs Visme?
Sheets: Insert → Chart on selected data. Visme: when you need branded column chart maker output, HTML5 embeds, or auto-updating charts from a linked Sheet.
Does Visme support live data and branded charts?
Connect a Google Sheet URL for auto-updates; upload fonts, colors, and logos in the brand kit and apply with one click.
How does Visme compare to Graphfree, ChartGo, and Canva?
Graphfree and ChartGo are faster and free with no account. Canva is broader for social graphics but fewer chart types and no Sheet live sync. Visme wins on chart depth, branding, and interactivity.
Can Visme create interactive or animated charts?
Yes — animations and hover states export in HTML5 for websites and embeds.
What is a graph maker based off conditions?
Charting filtered subsets (e.g. one quarter or product line). Prepare or filter data in Visme's editor or Sheets, then map columns to series — not a full rule engine, but enough for common workflows.
Try in BeCharts
Open ready-made bar charts templates or jump straight into the editor with sample data loaded.